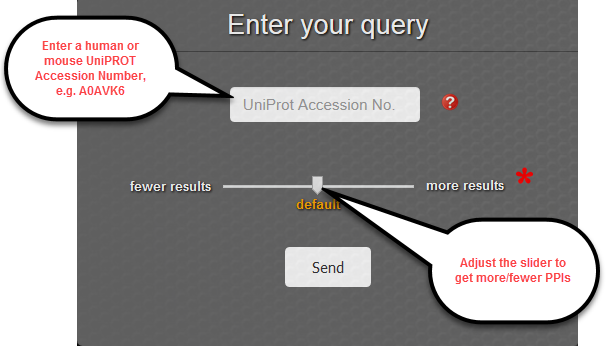
Through the interface, a user can query UniReD using just a UniProt accession number (Fig.1). For the time being, Mus Musculus and Homo sapiens accession numbers are acceptable, but more organisms will be supported soon. A user can get more/fewer PPIs using a sliding selector. On the back-end, the slider adjusts the inflation value of the MCL algorithm.
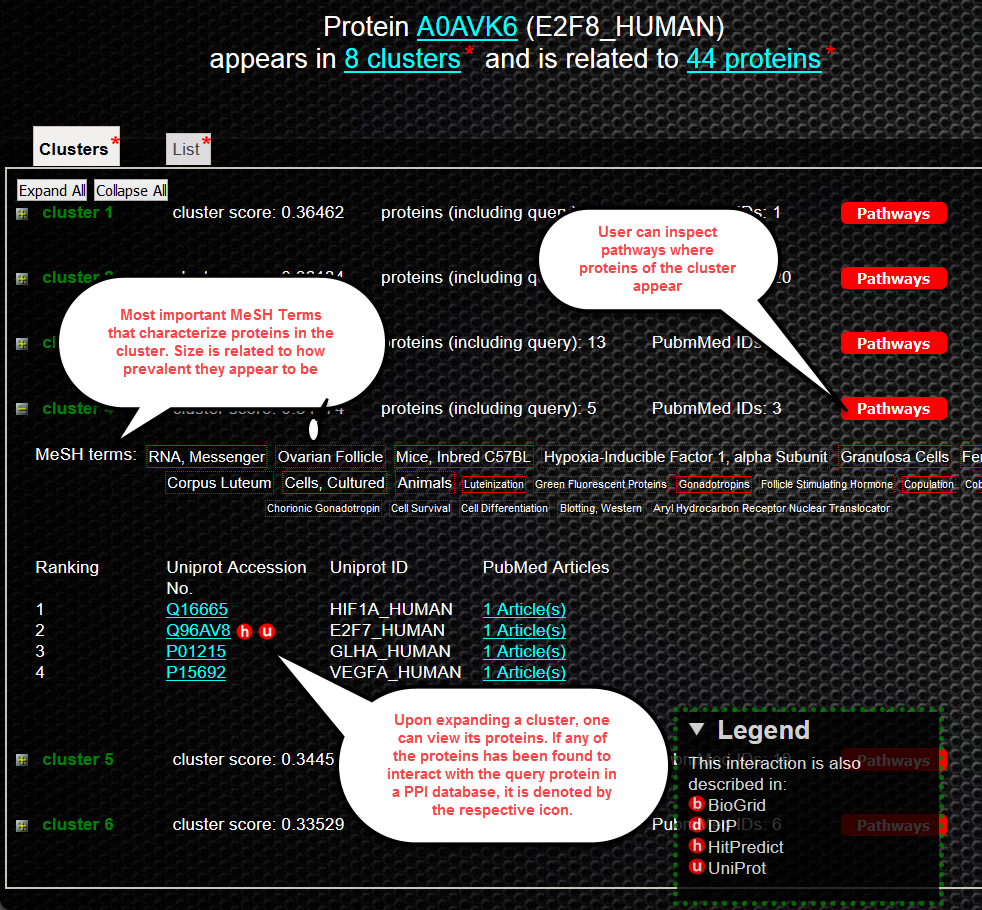
Every time a query is performed, all clusters containing the UniProt Accession Number are pulled from our precalculated results and presented to the user along with some additional information. In detail, at the top of the web page, a summary displaying the UniProt Accession Number & the UniProt ID of the UniProt entity is presented. In addition, the number of clusters in which the query protein appears along with the number of predicted proteins interactors are shown. Detailed information can be downloaded and the results can be displayed in two modes, namely Cluster view and List View.
A typical Cluster view is shown in Figure 2. In this view, all clusters are displayed, sorted by a cluster score (using the GS2 algorithm). Next to each cluster, the user can view the cluster score, the number of proteins in the cluster and the number of unique PubMed IDs where this information was found.
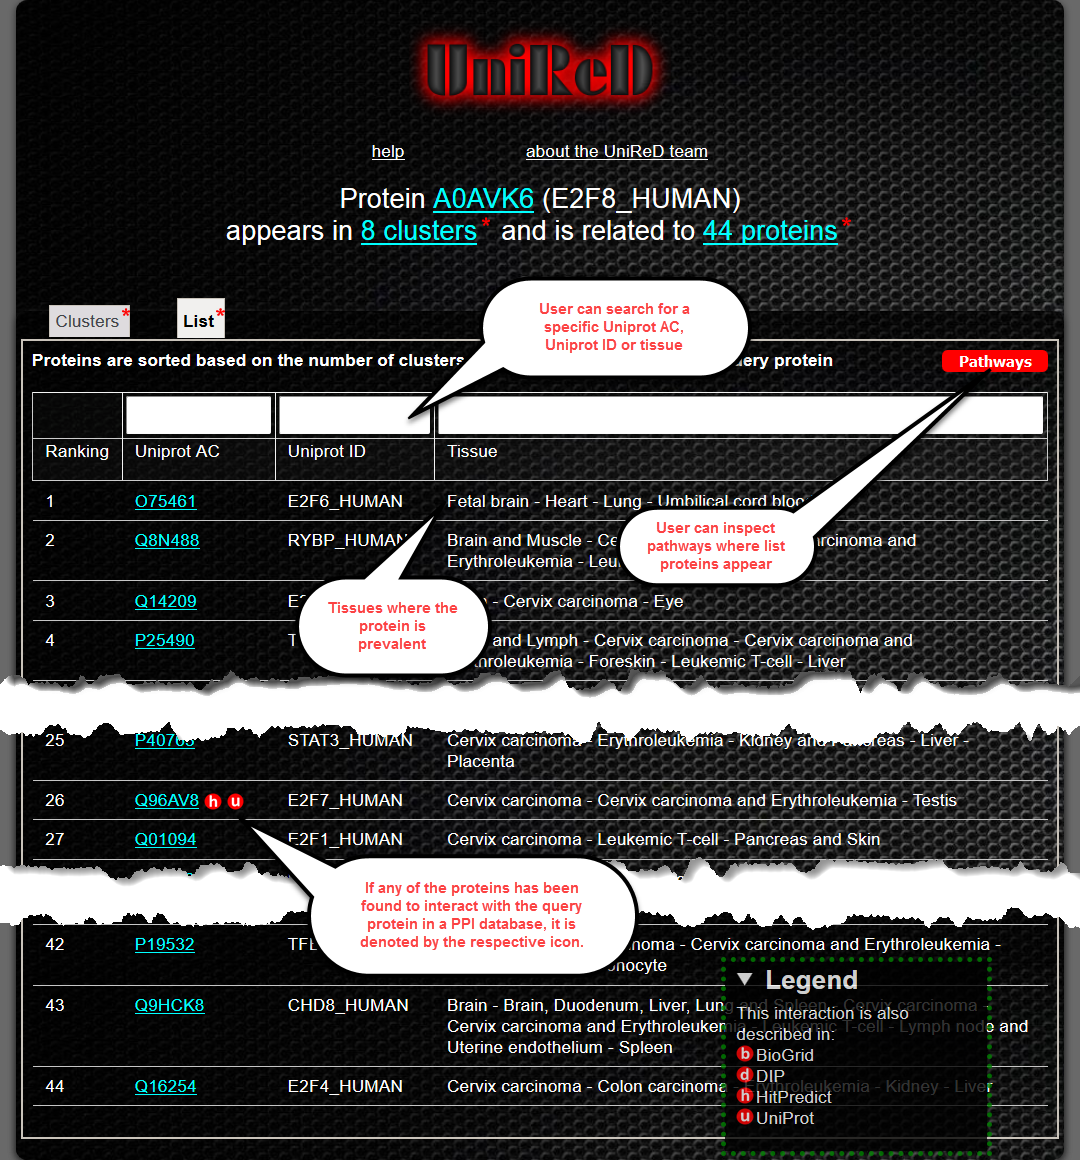
A typical List view is shown in Figure 3. For each cluster displayed in the Cluster View, the List option displays all the unique proteins, proposed to be functionally related with the protein of interest. Like in the Cluster View, the proteins are sorted by their GO similarity score. In addition, by using text filtering, users can sort or filter the list based on various reported features related to a protein. Such a feature could be for example filtering by expression in a specific tissue. While each known interaction is marked by an icon like in Cluster View, tissue expression derived from the SwissProt database (local updated copy) is also displayed for each Uniprot entity.